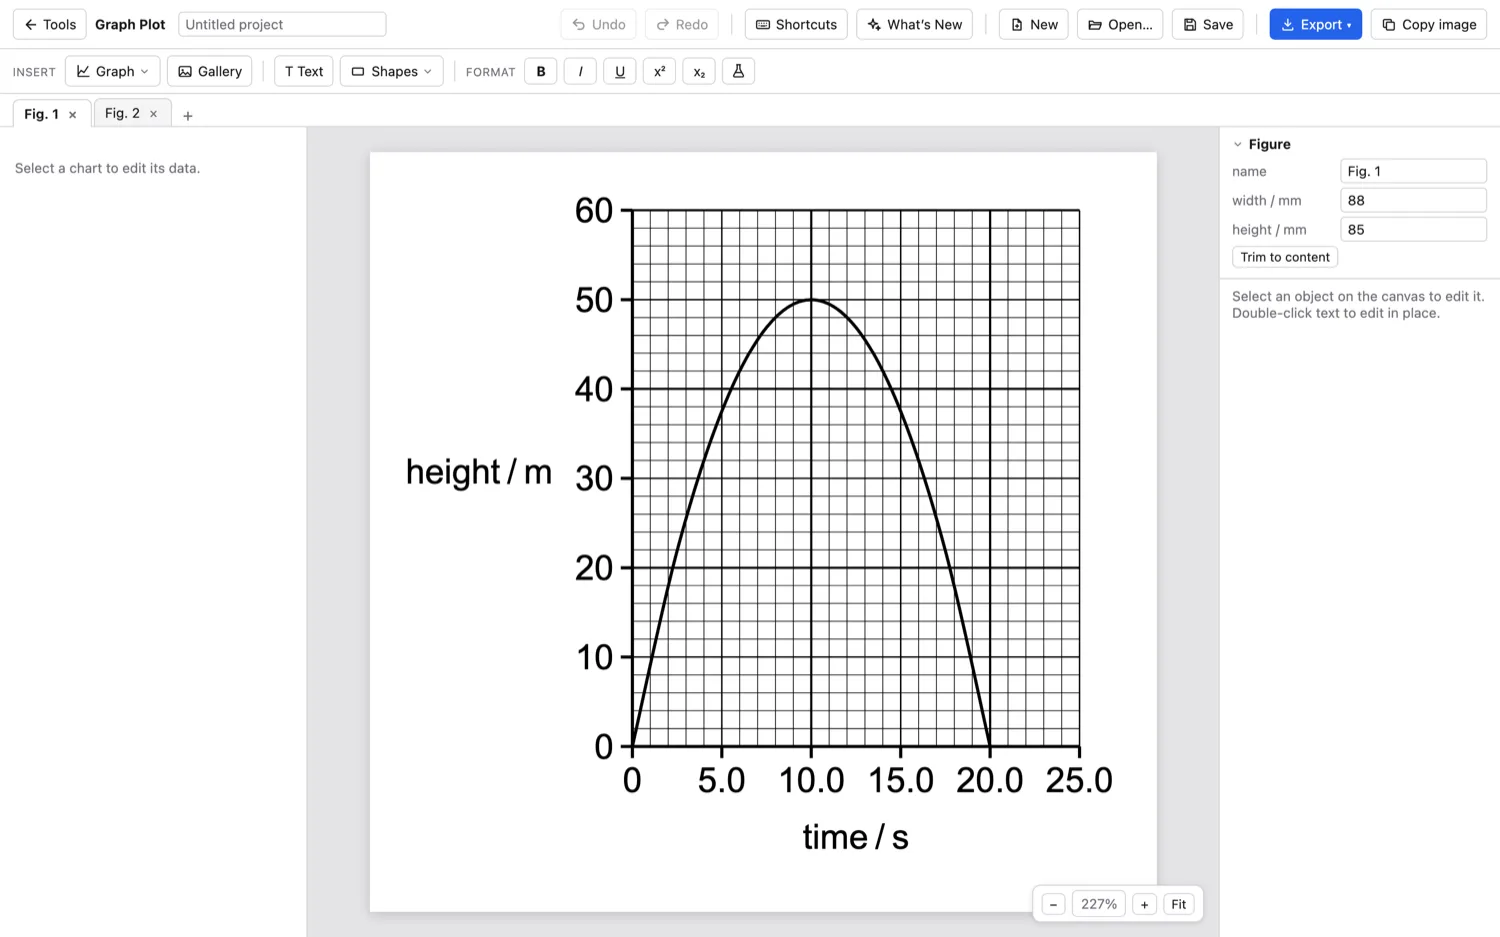
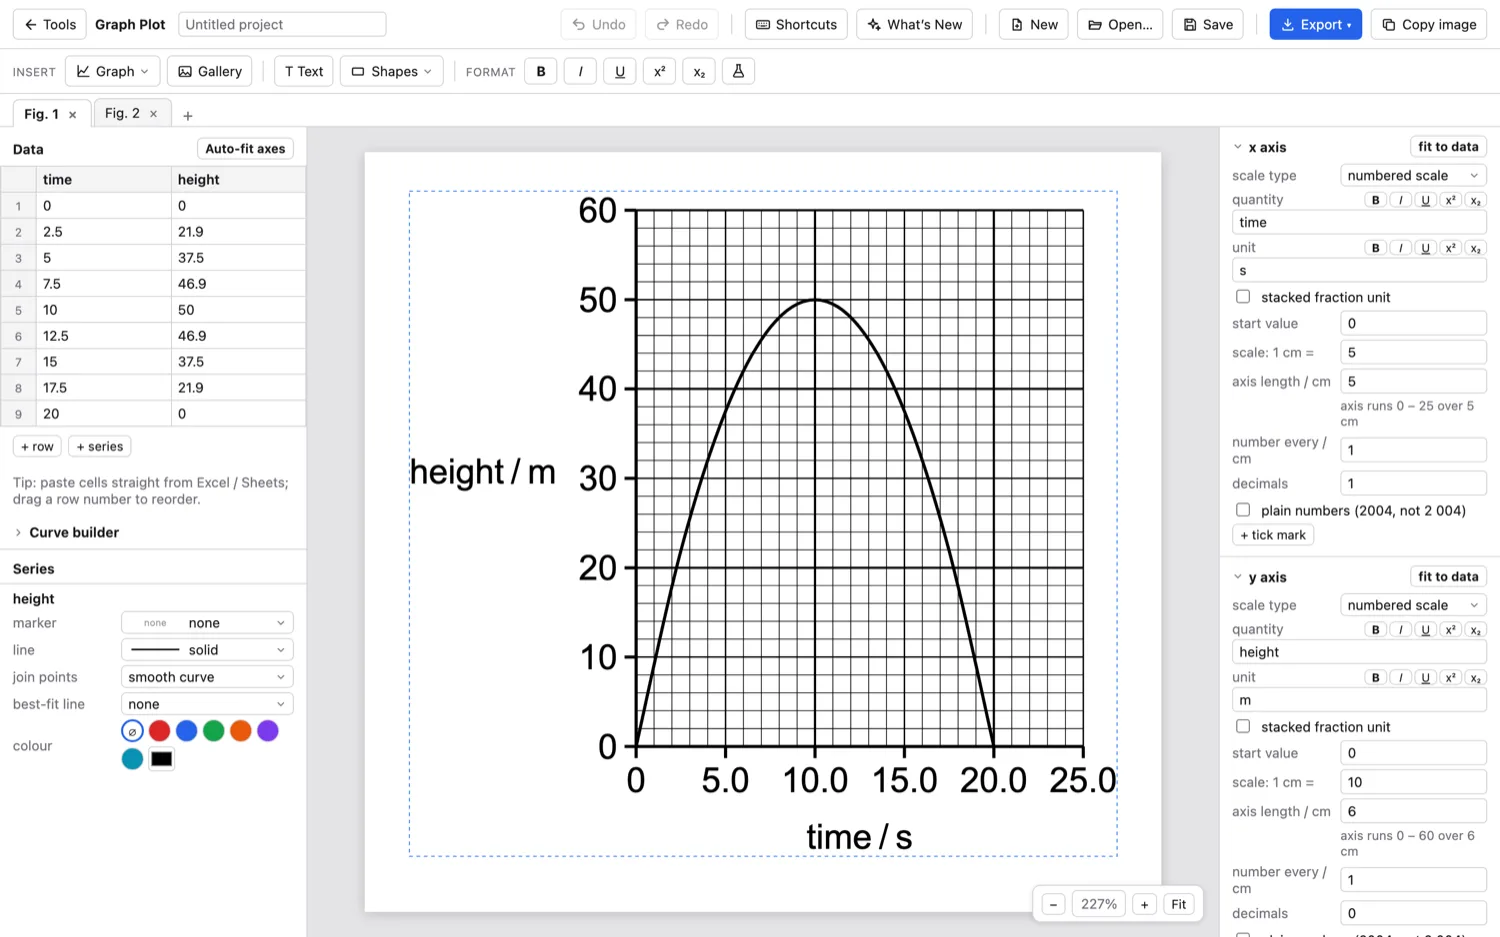
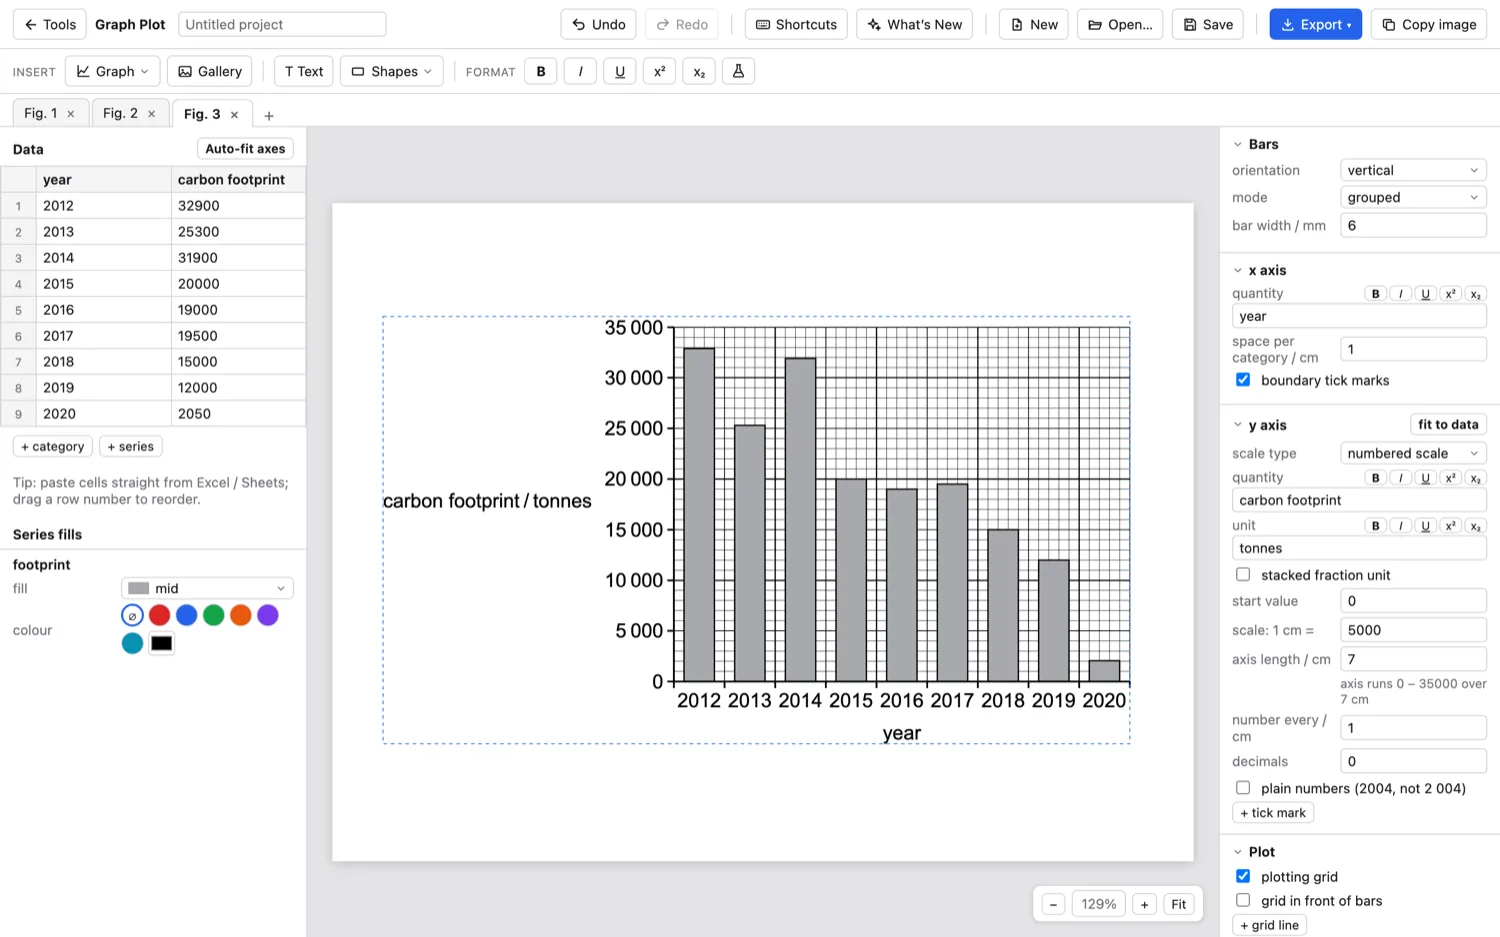
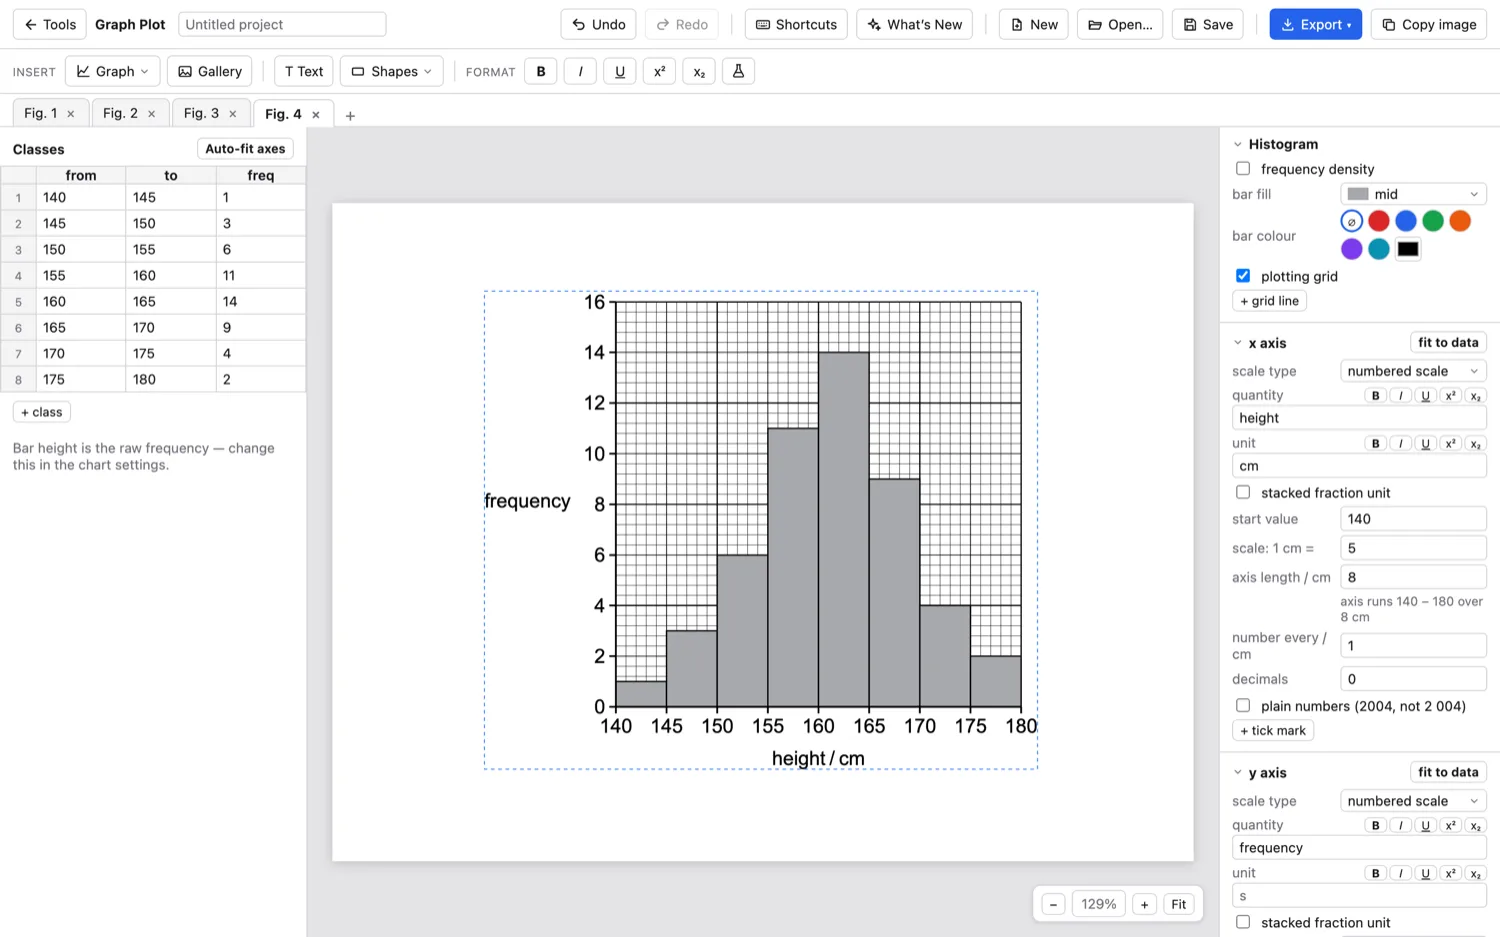
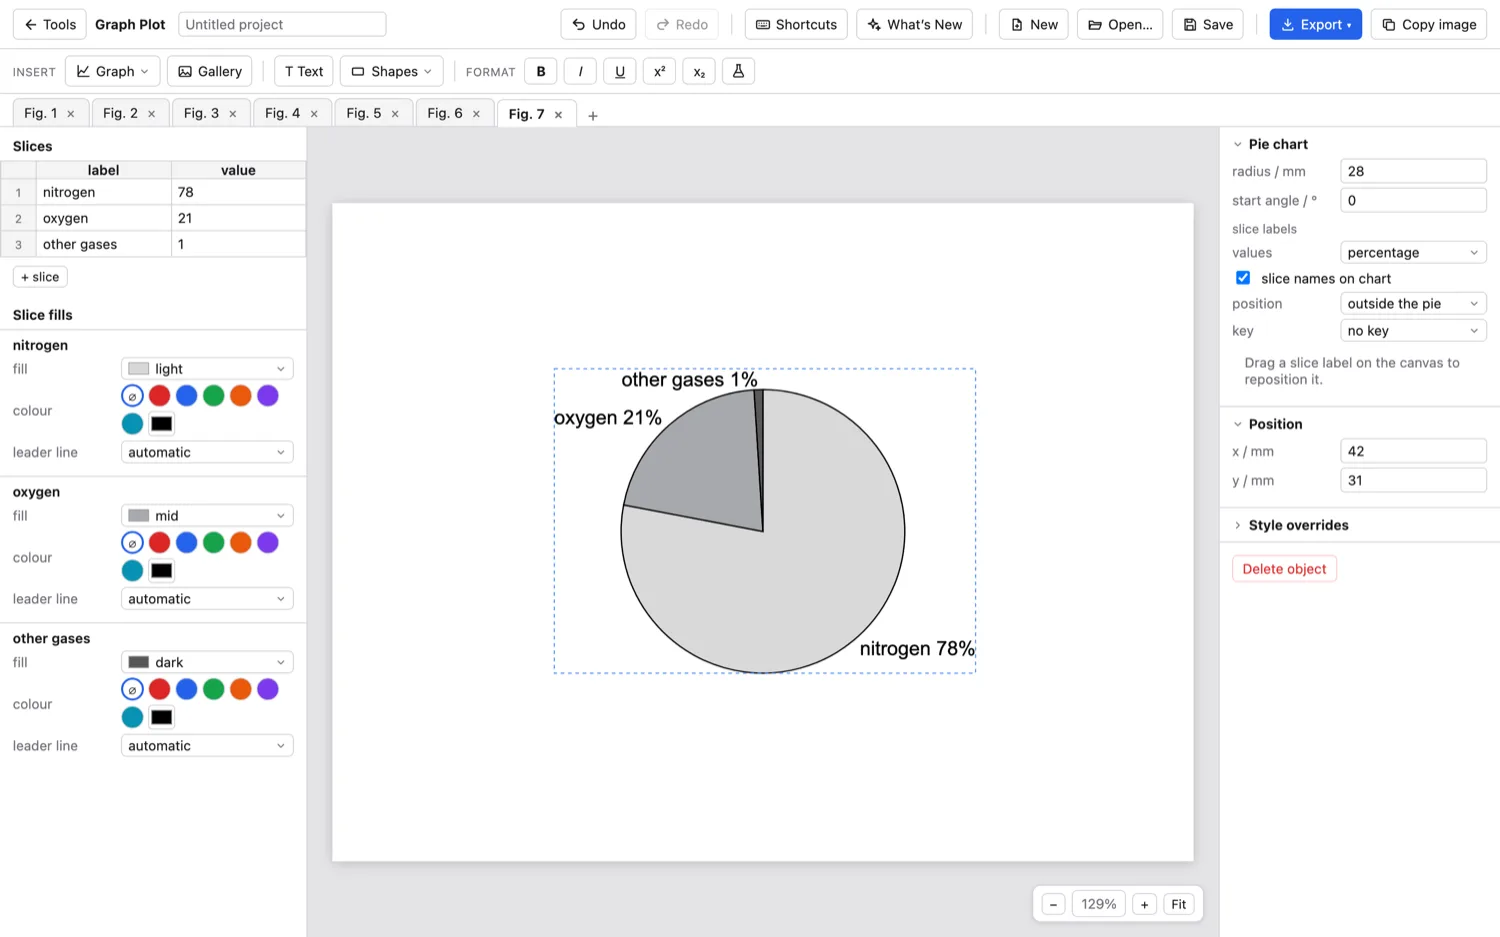
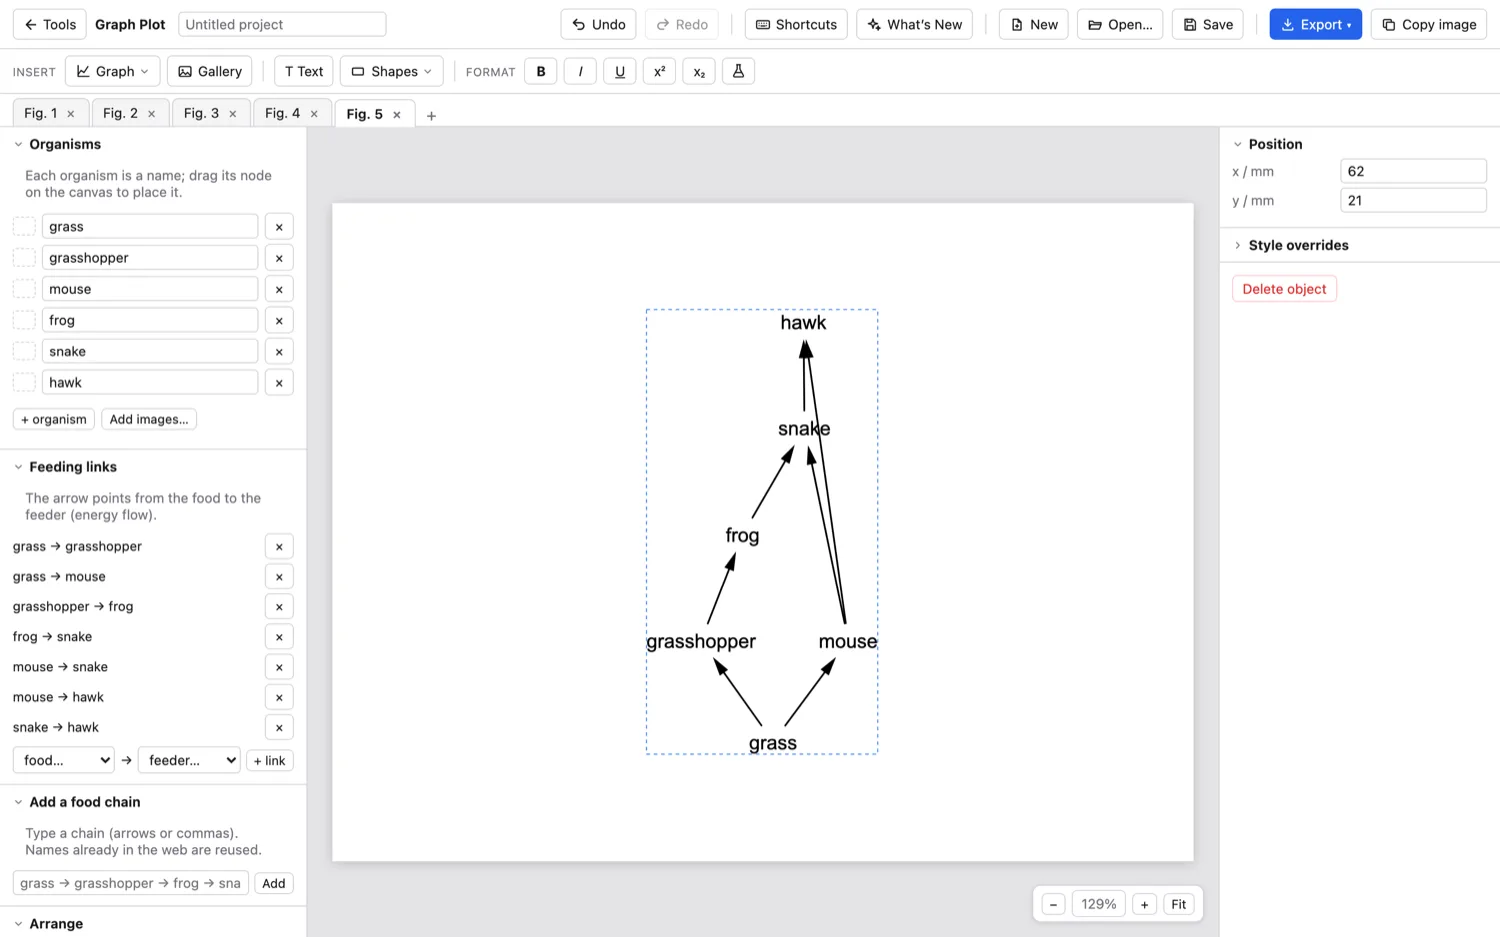
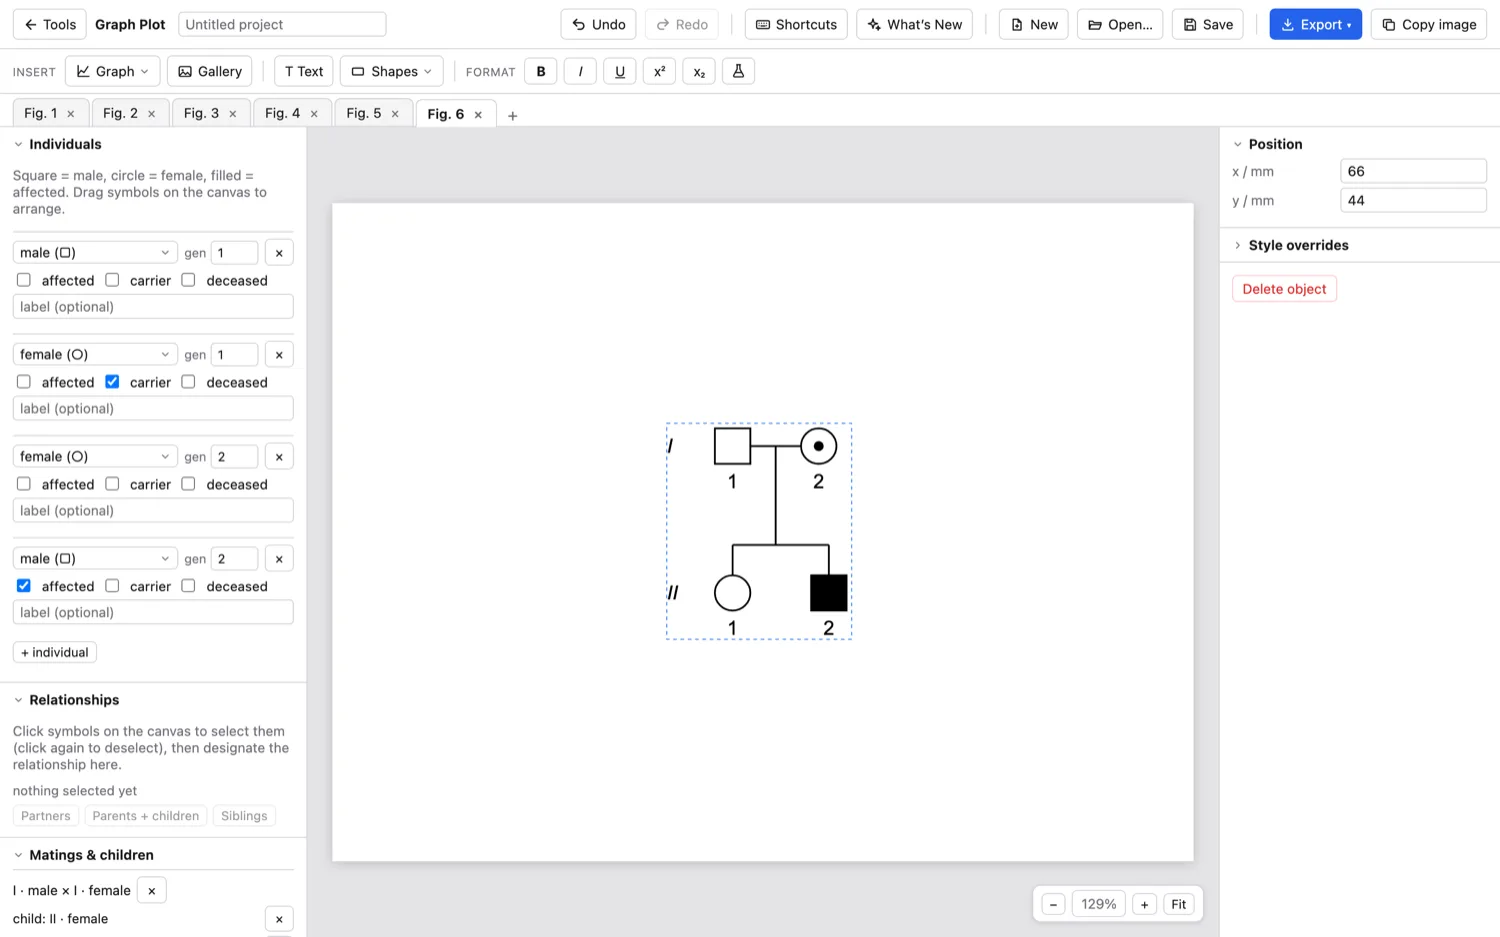
Graph Plot
Exam-style graphs that print at true size.
Draw the graphs your students meet in exams, on proper squared grids, then print them at real size so they match the paper. It does food webs and pedigree charts too.
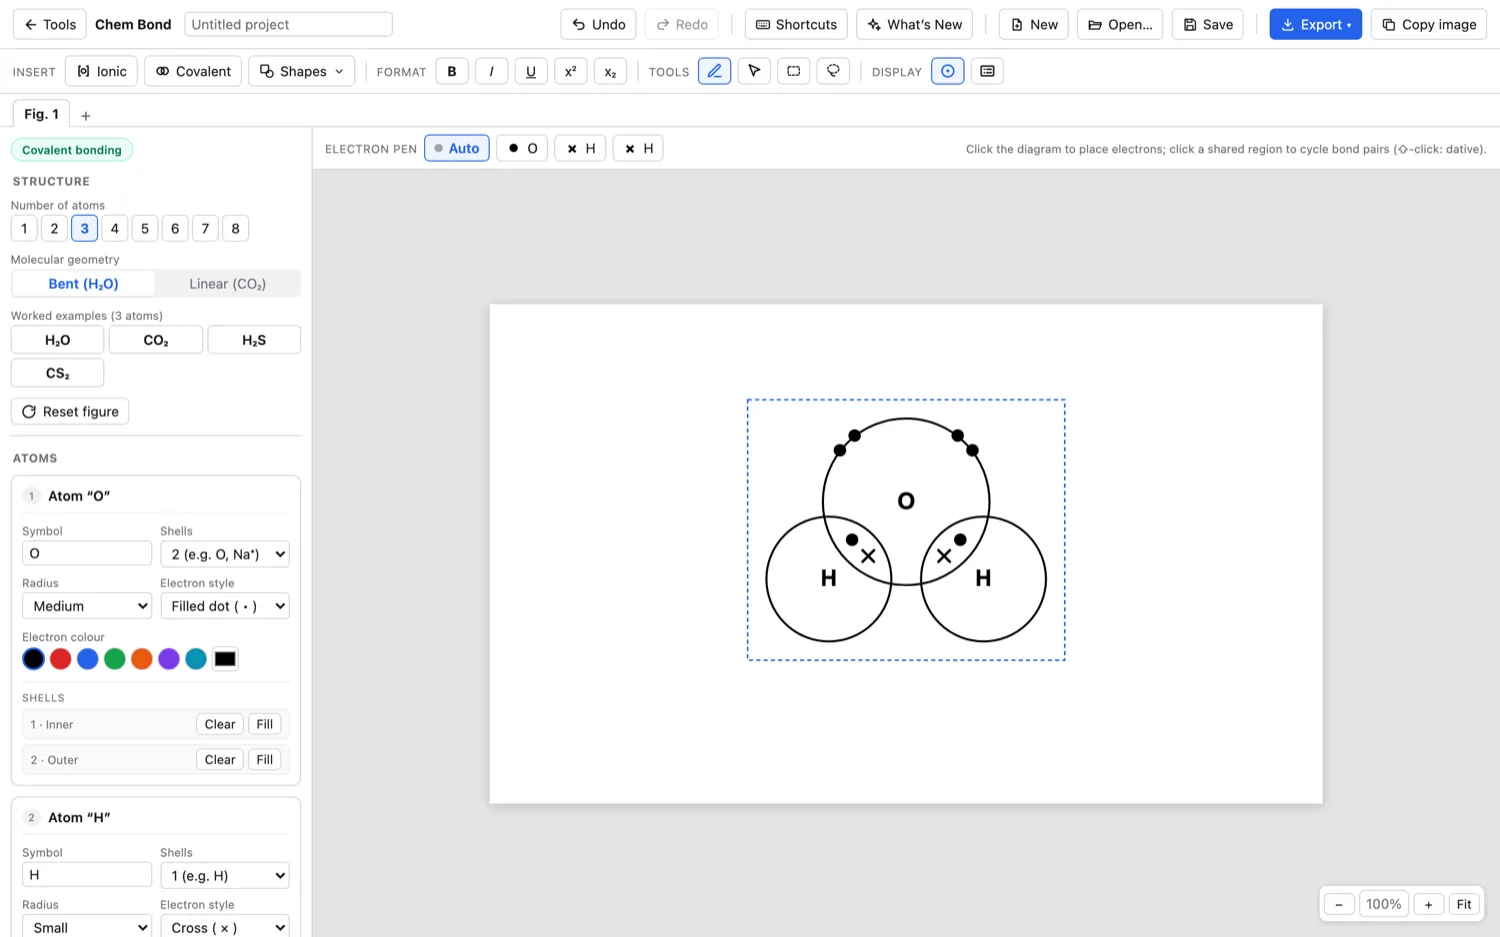
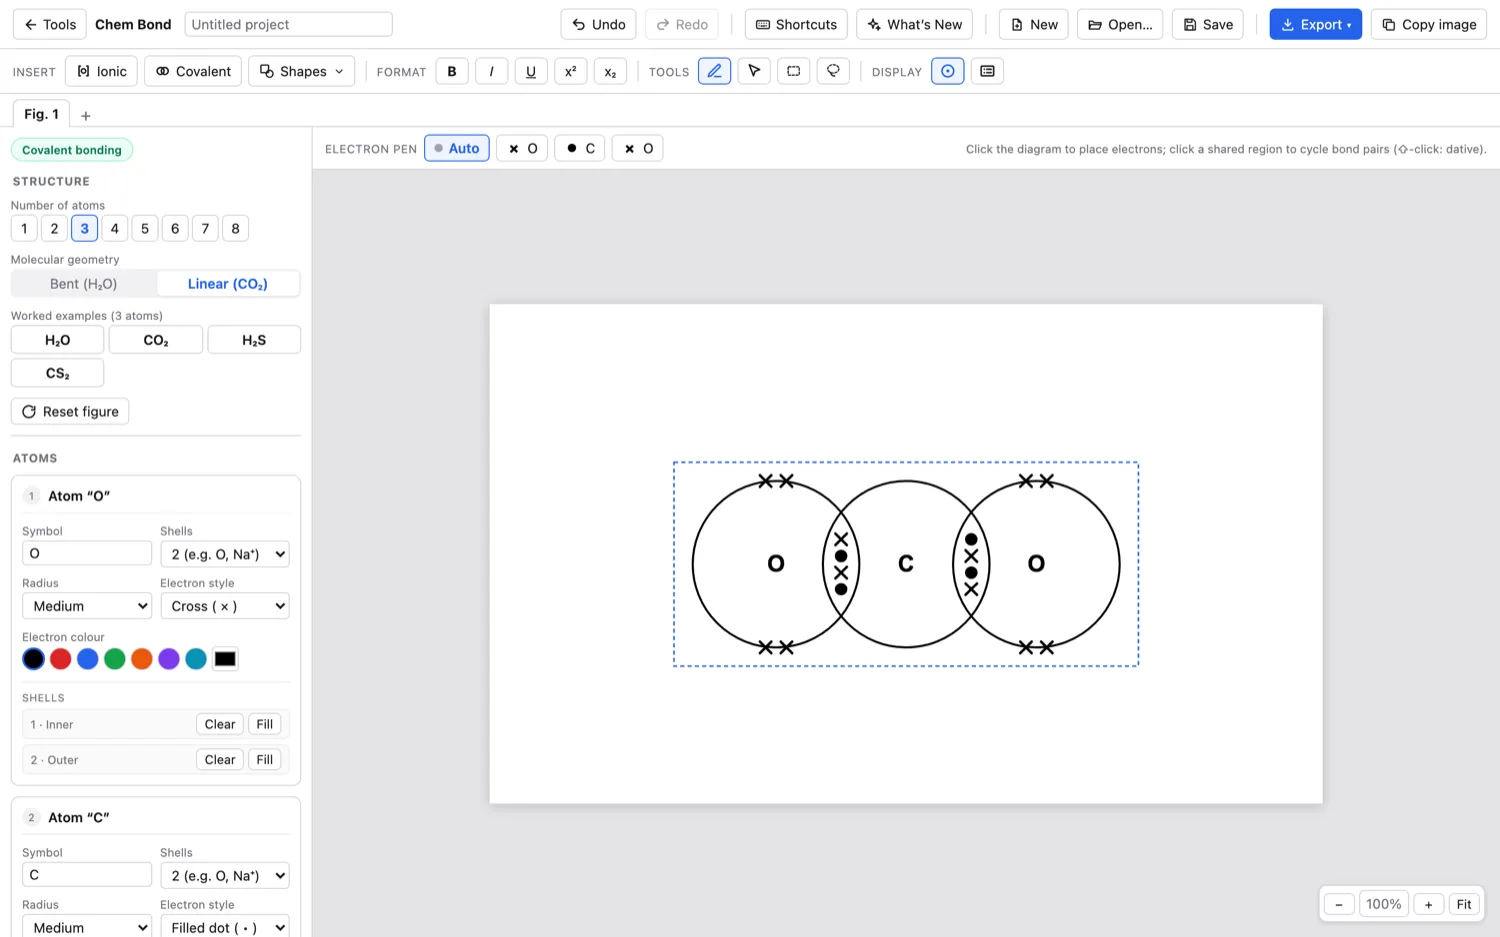
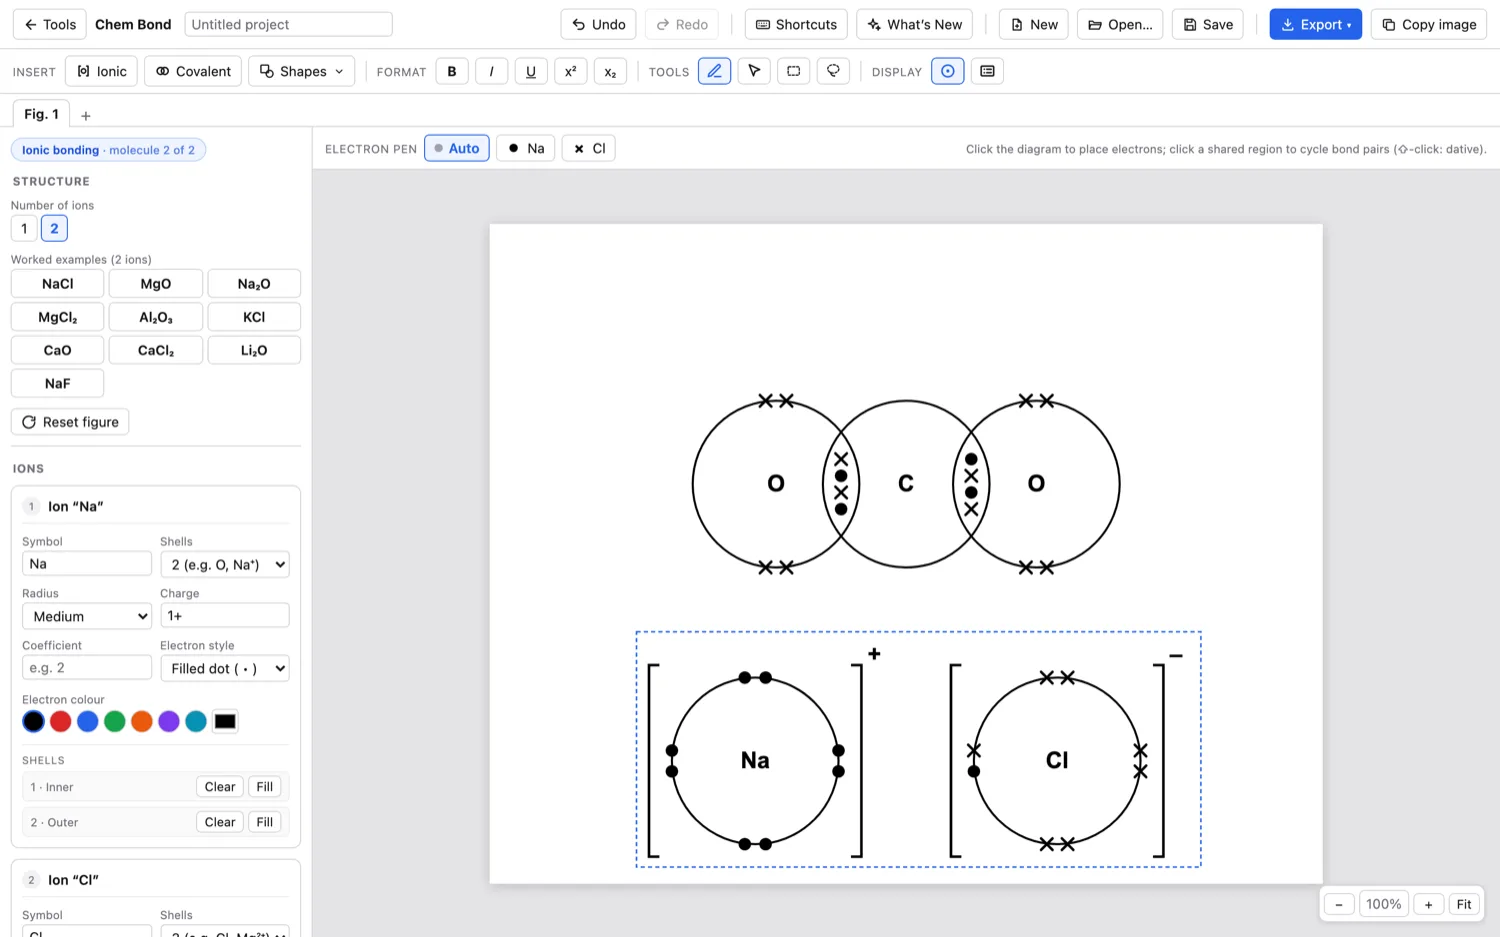
Chem Bond
Dot-and-cross diagrams, done for you.
Pick a molecule and it draws the dot-and-cross diagram: shells, shared pairs, brackets and charges. Change any electron if you want to.
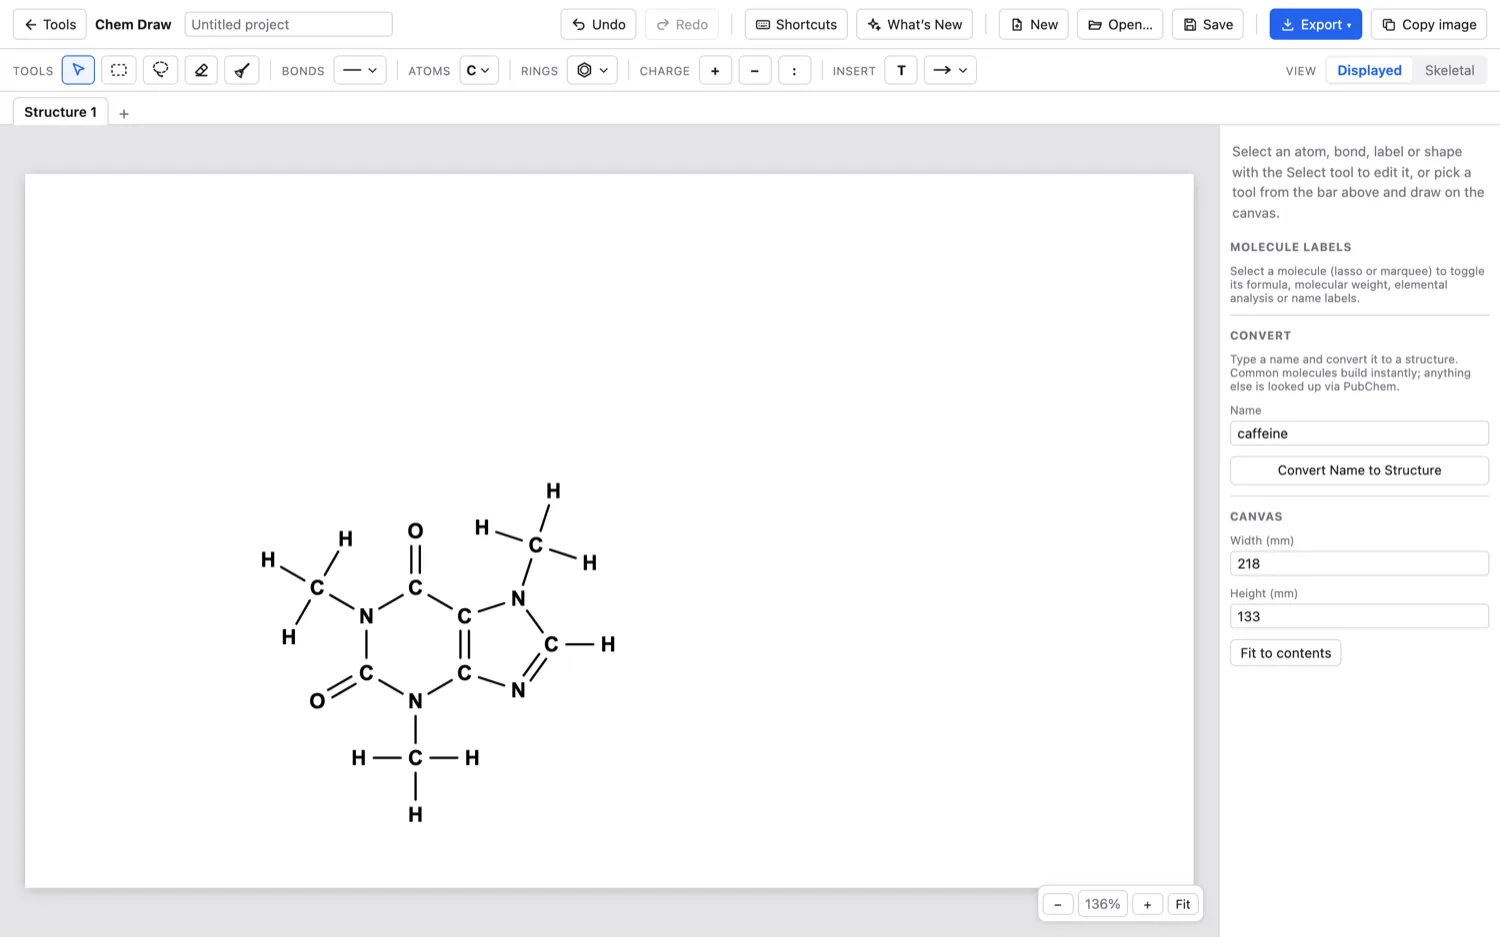
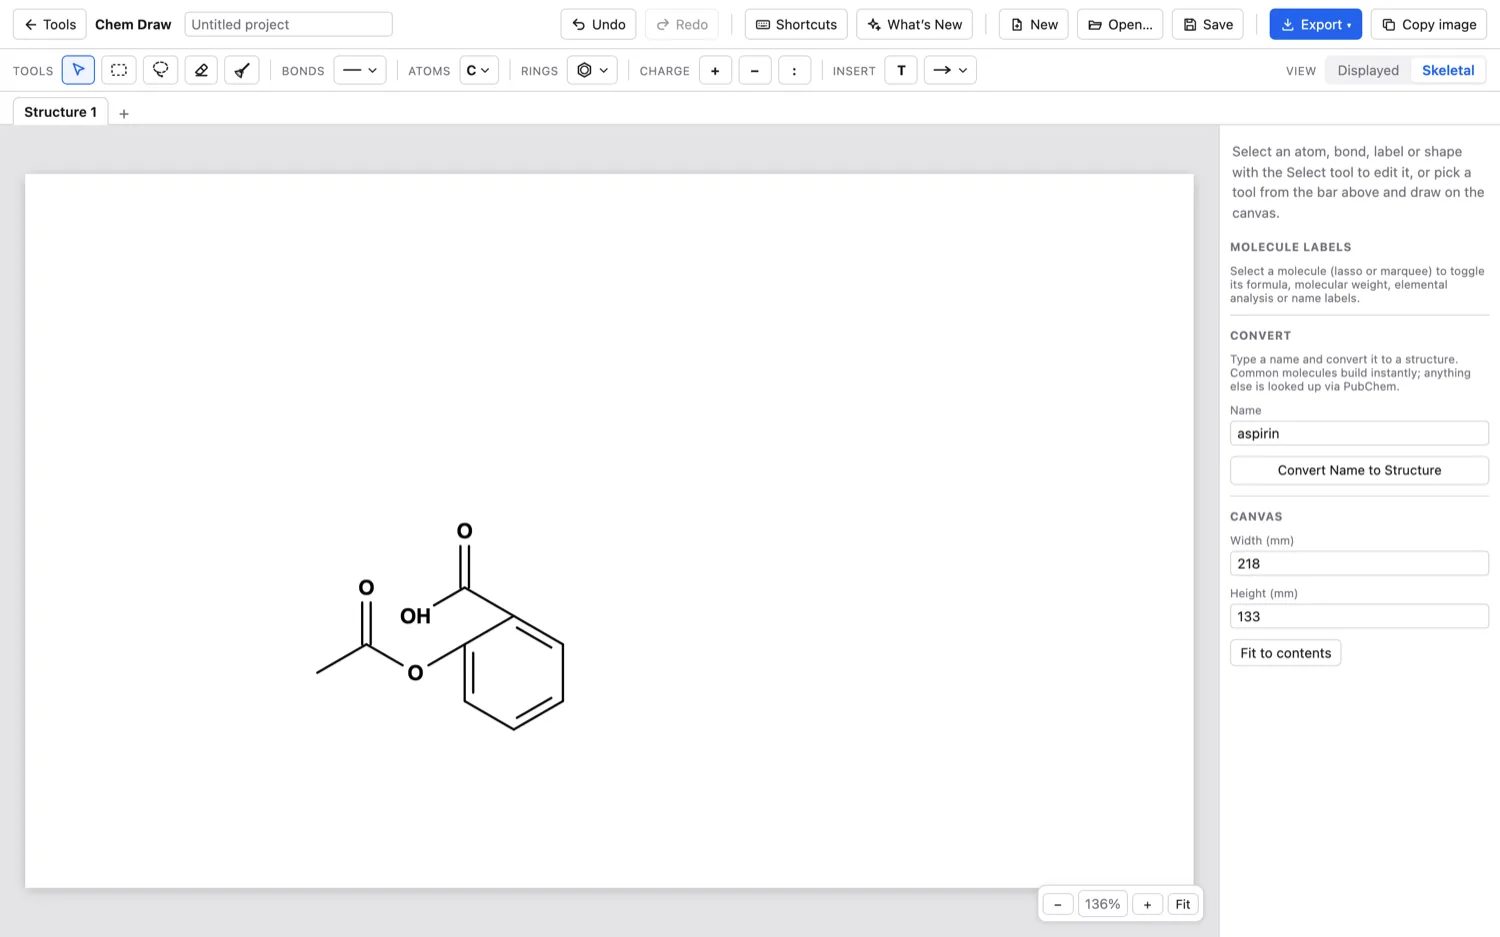
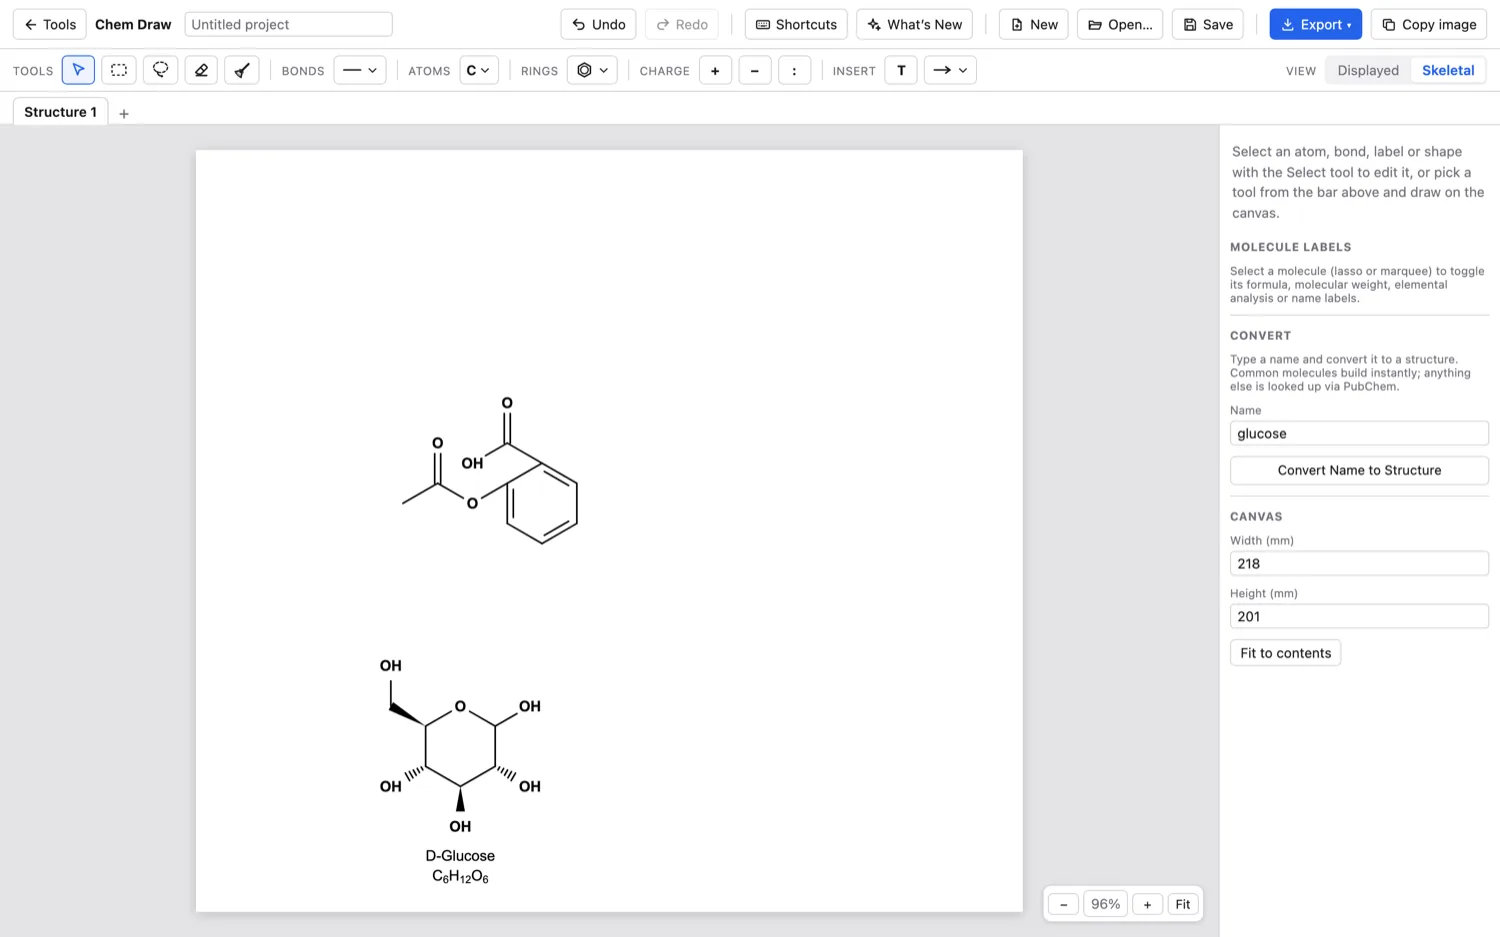
Chem Draw
Type a name, get the structure.
Type a molecule like caffeine or ethanol and it draws the structure. Switch between displayed and skeletal, and show the formula, mass or name.
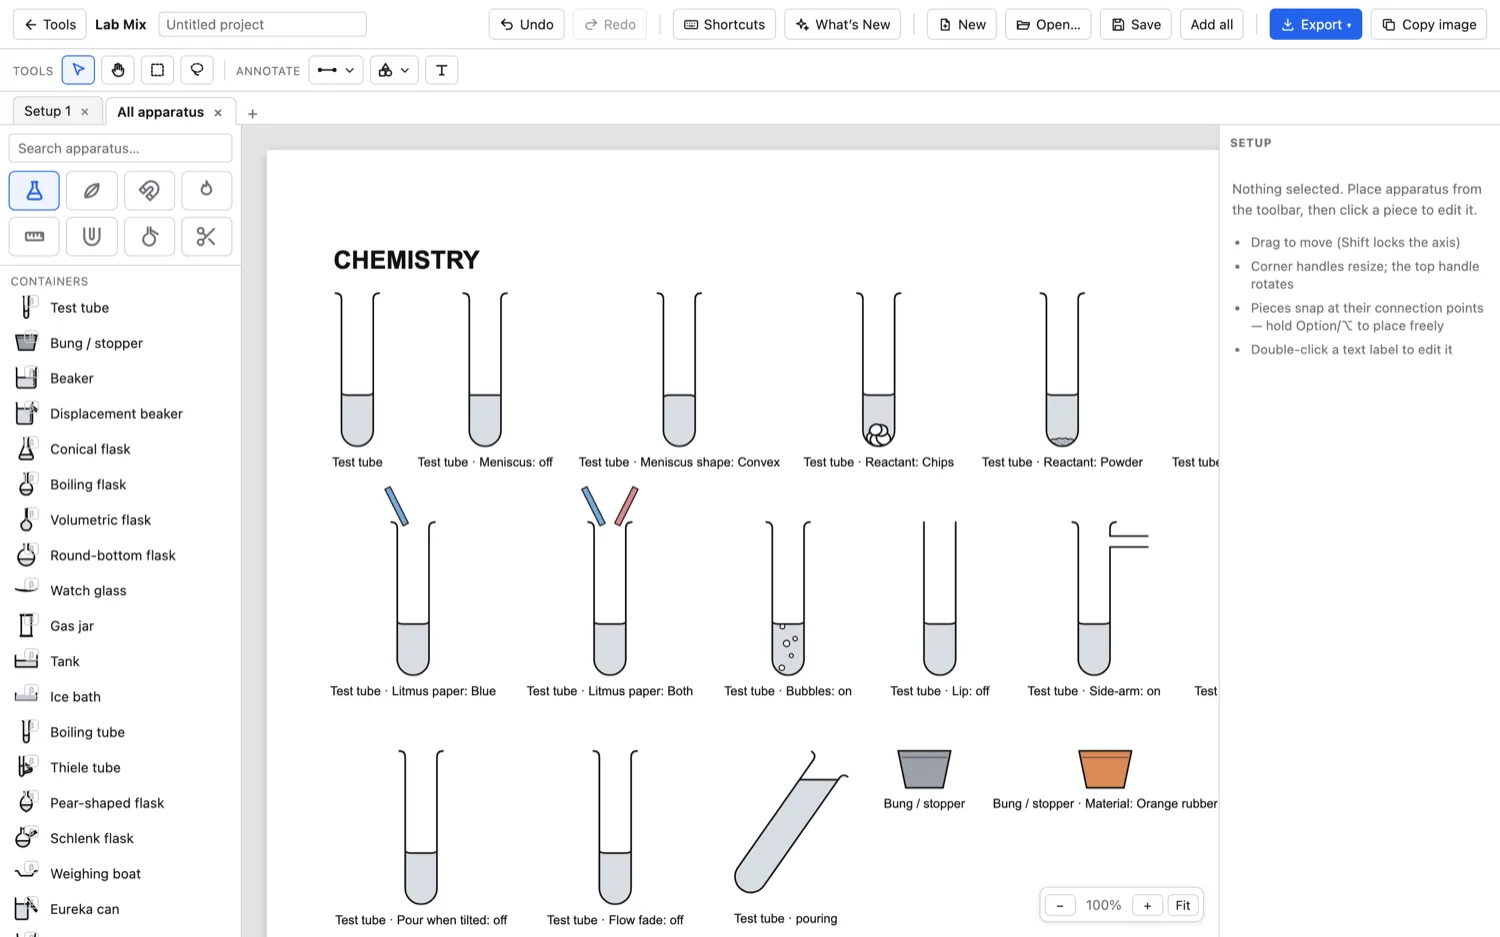
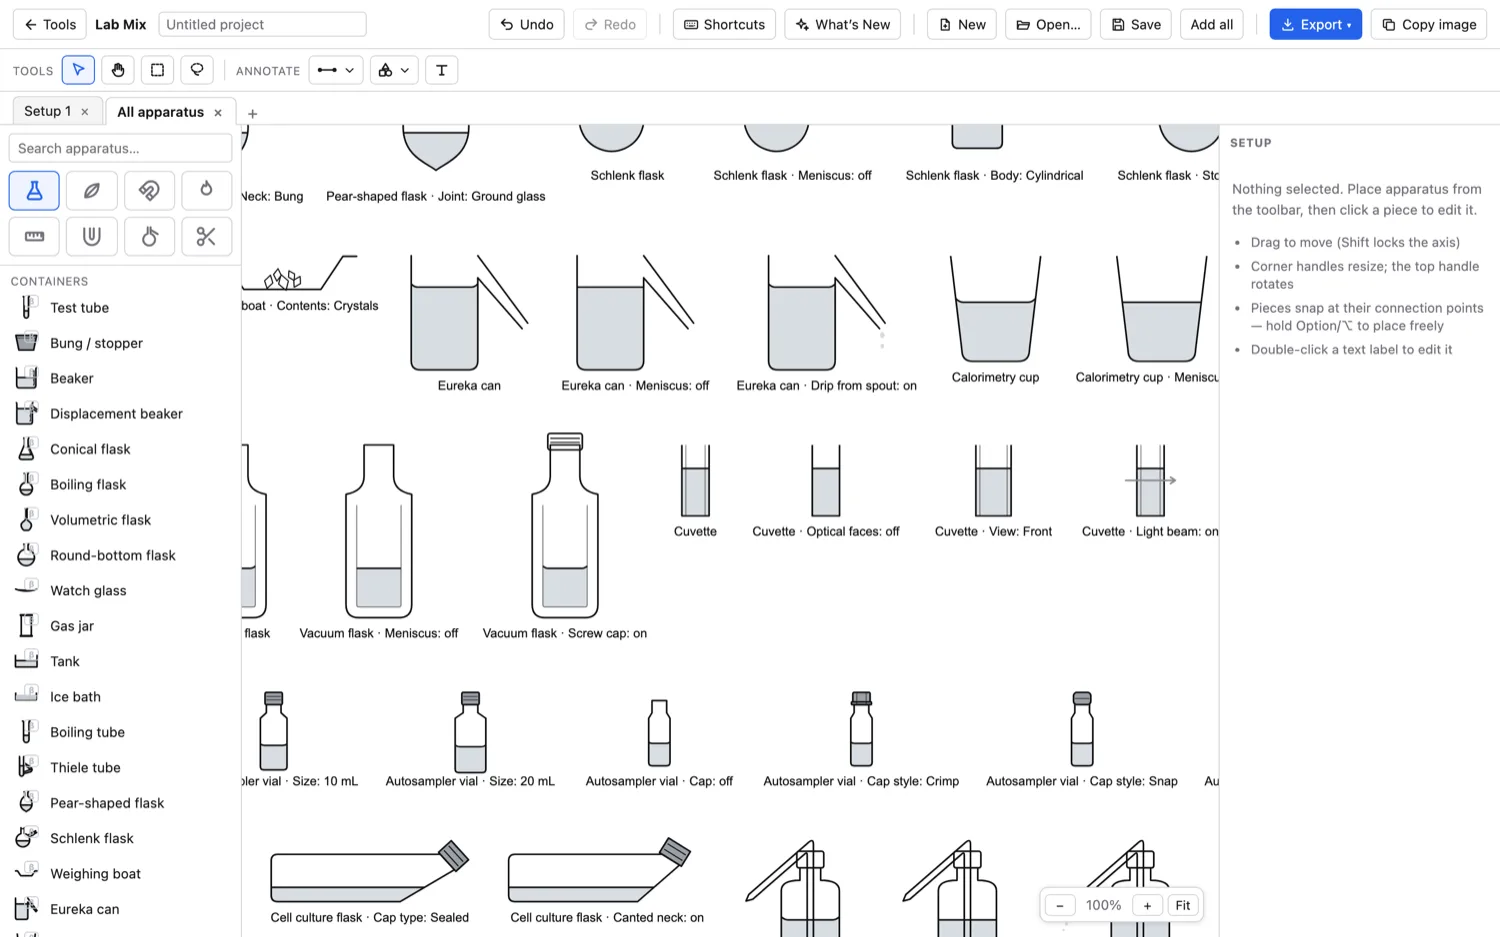
Lab Mix
Apparatus diagrams that follow the mark scheme.
Build a setup from a library of glassware and equipment. Pieces snap together where they connect, and there is optics and circuits as well.
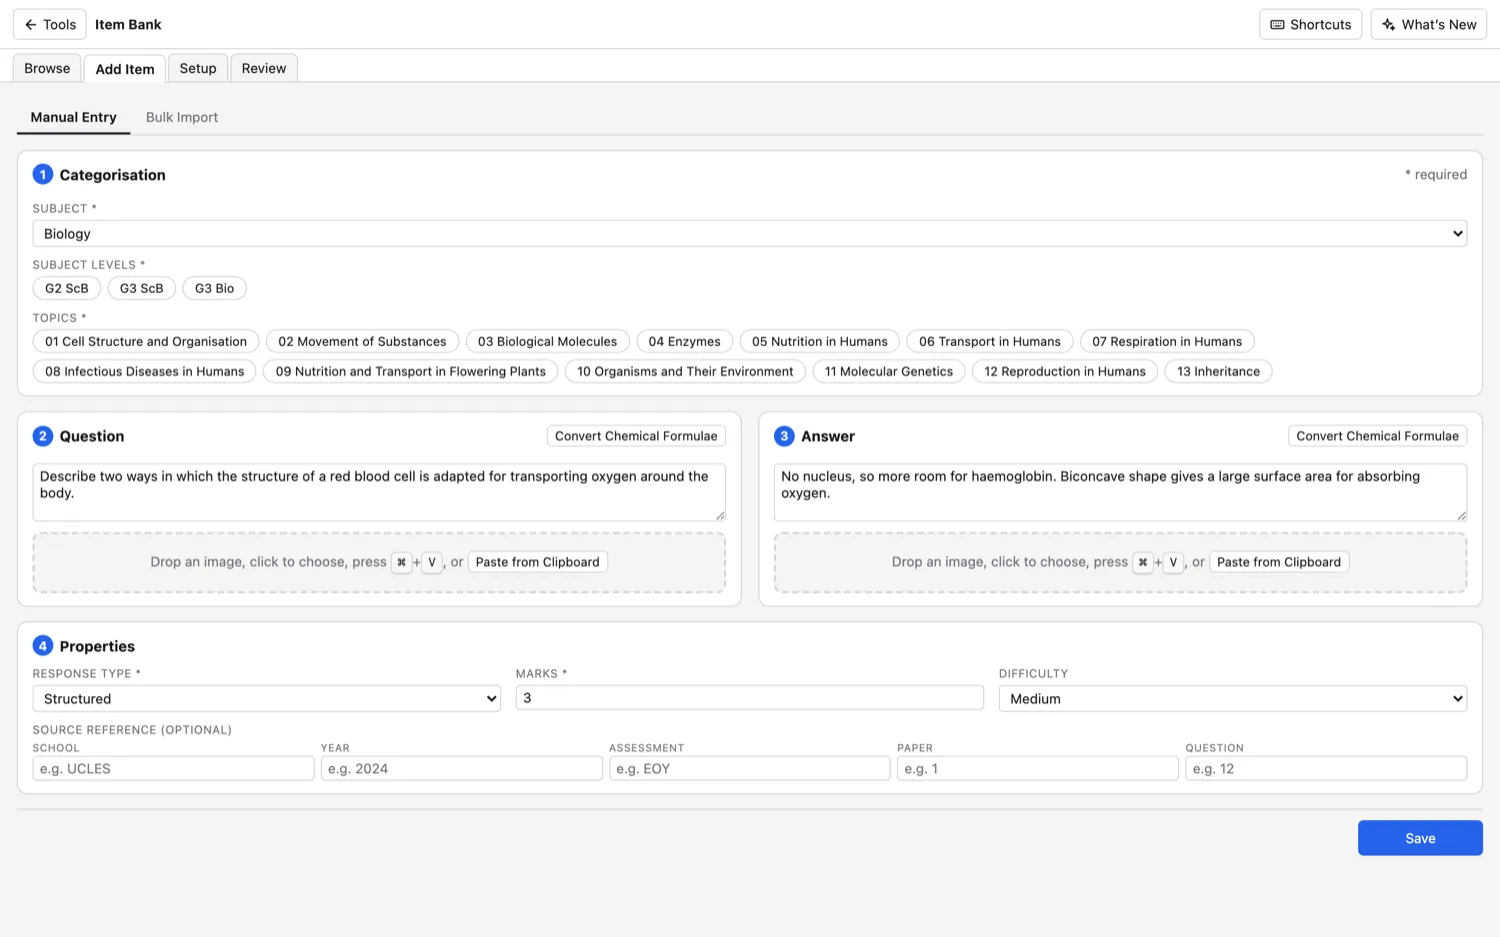
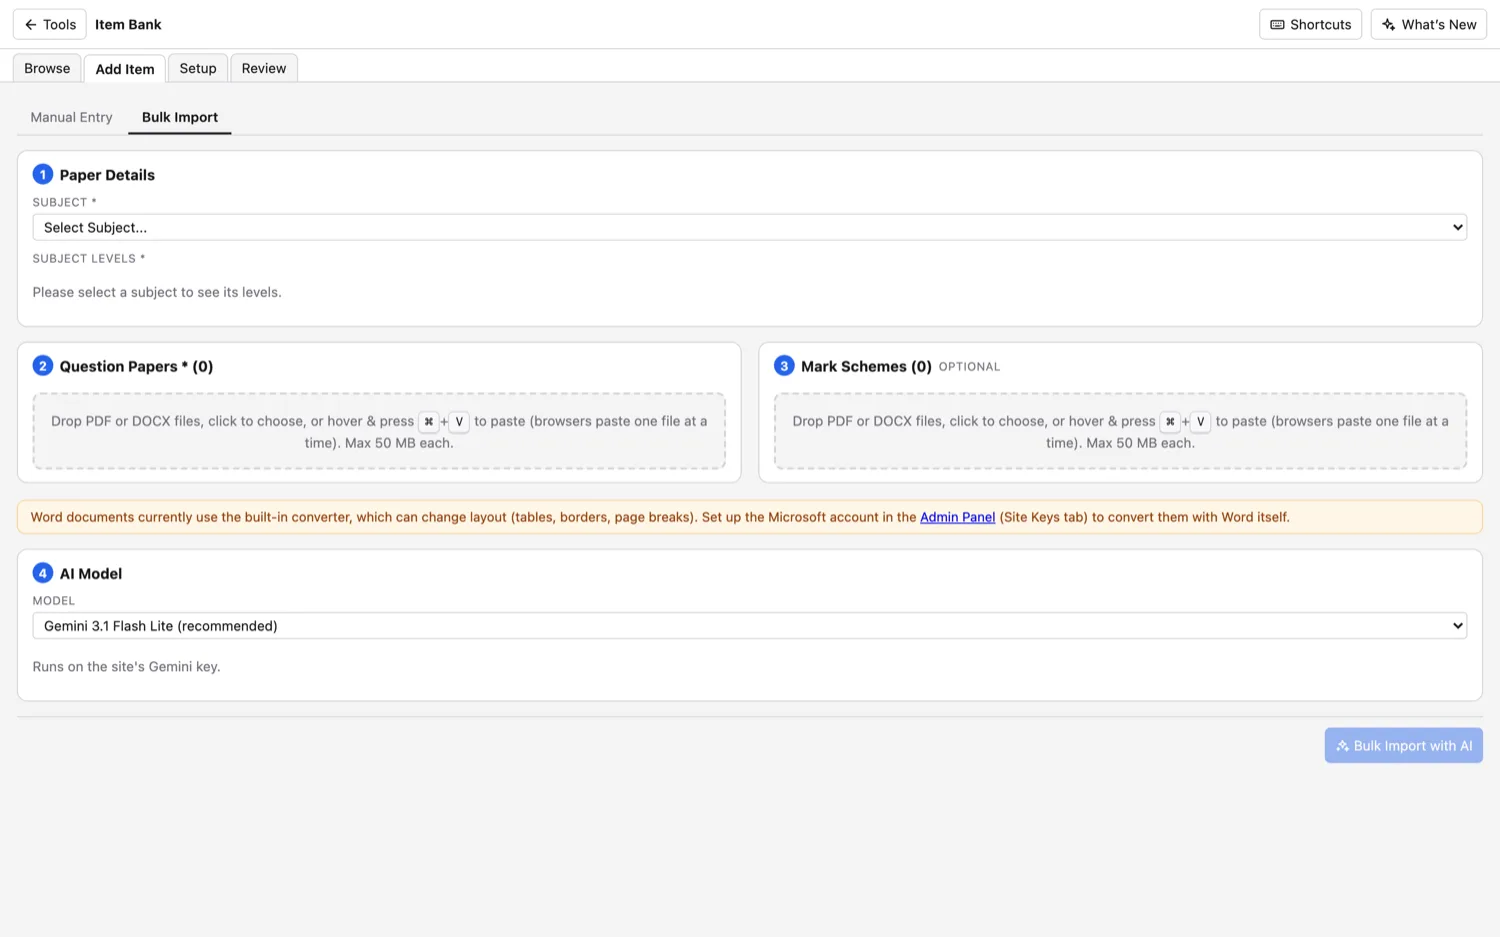
Item Bank
All your questions, searchable.
Build up a bank of exam questions. Add them by hand or import a PDF, and tag each one by subject, topic, level and marks so you can find it later.
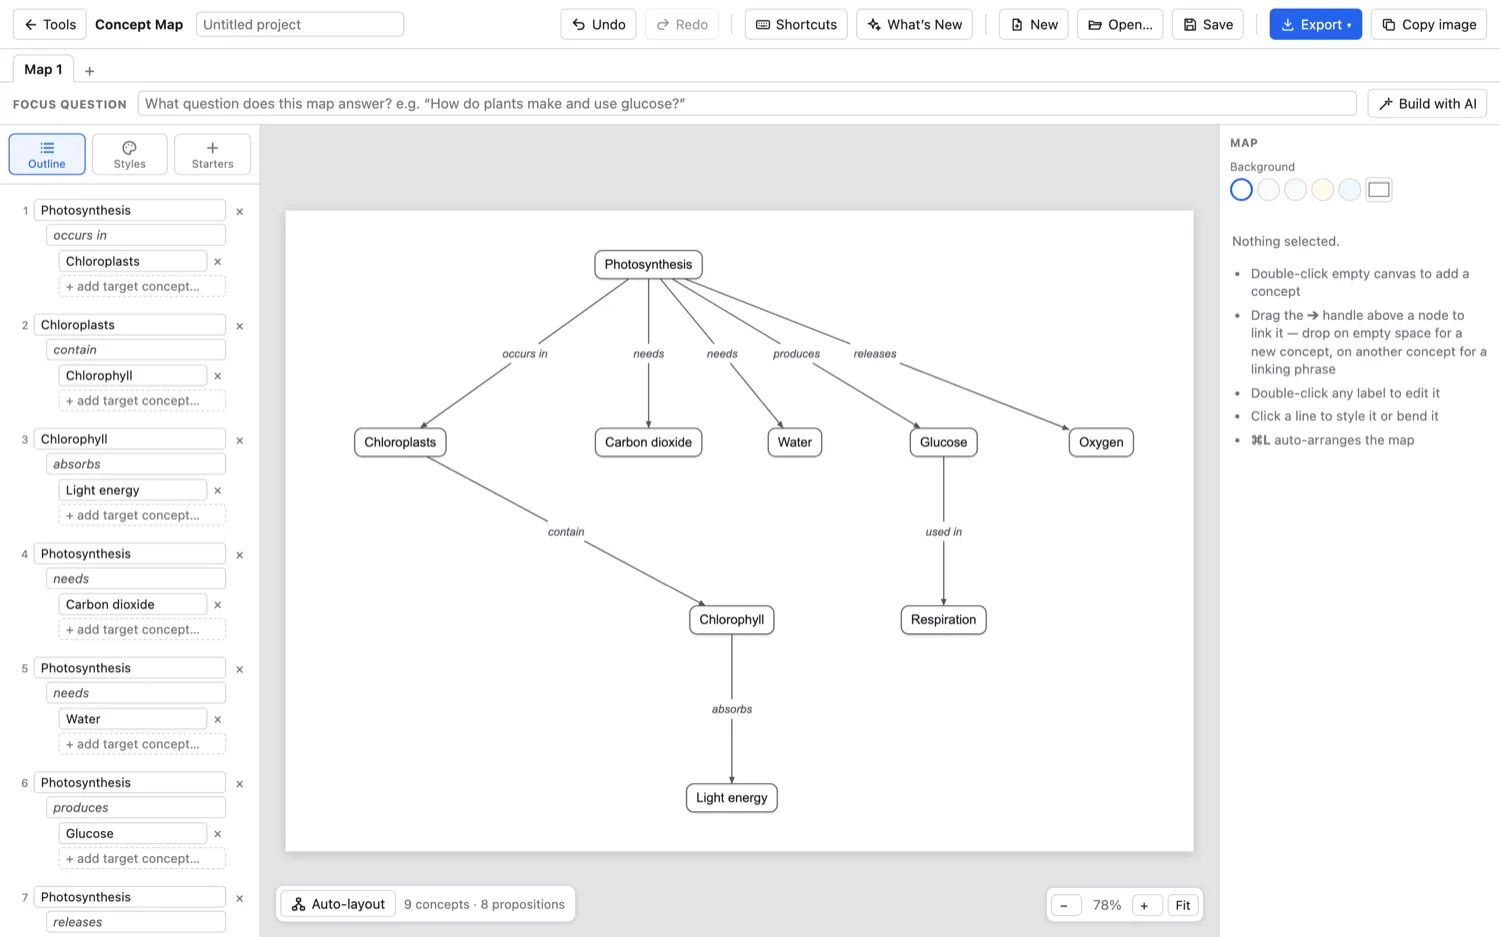
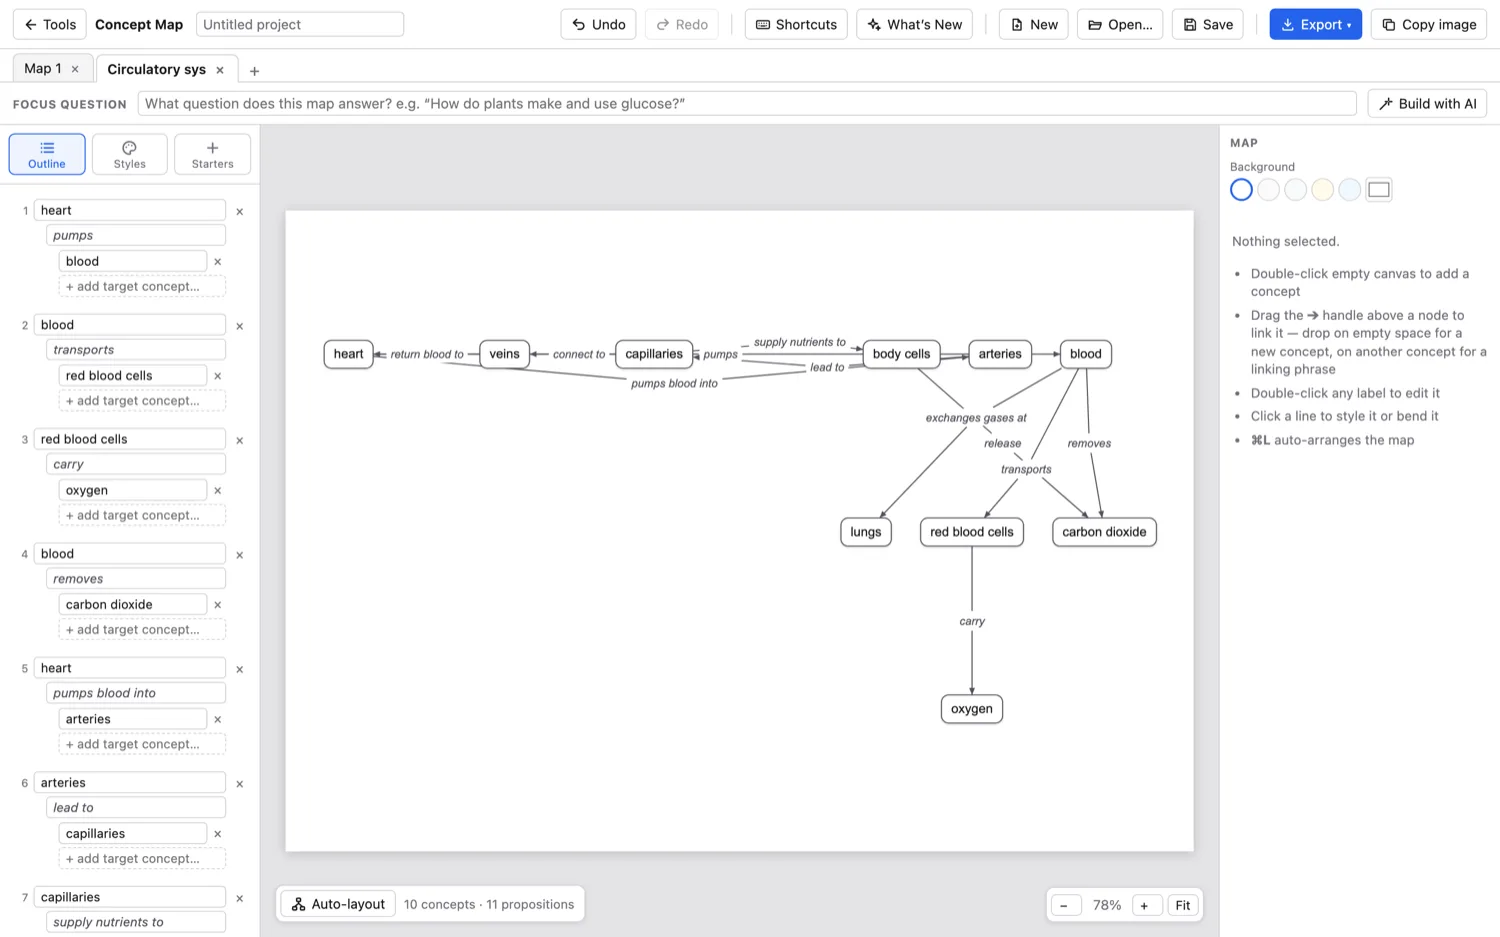
Concept Map
Show how ideas link up.
Join ideas with labelled arrows. Type the links yourself, or list a few concepts and let the AI connect them and tidy the layout.
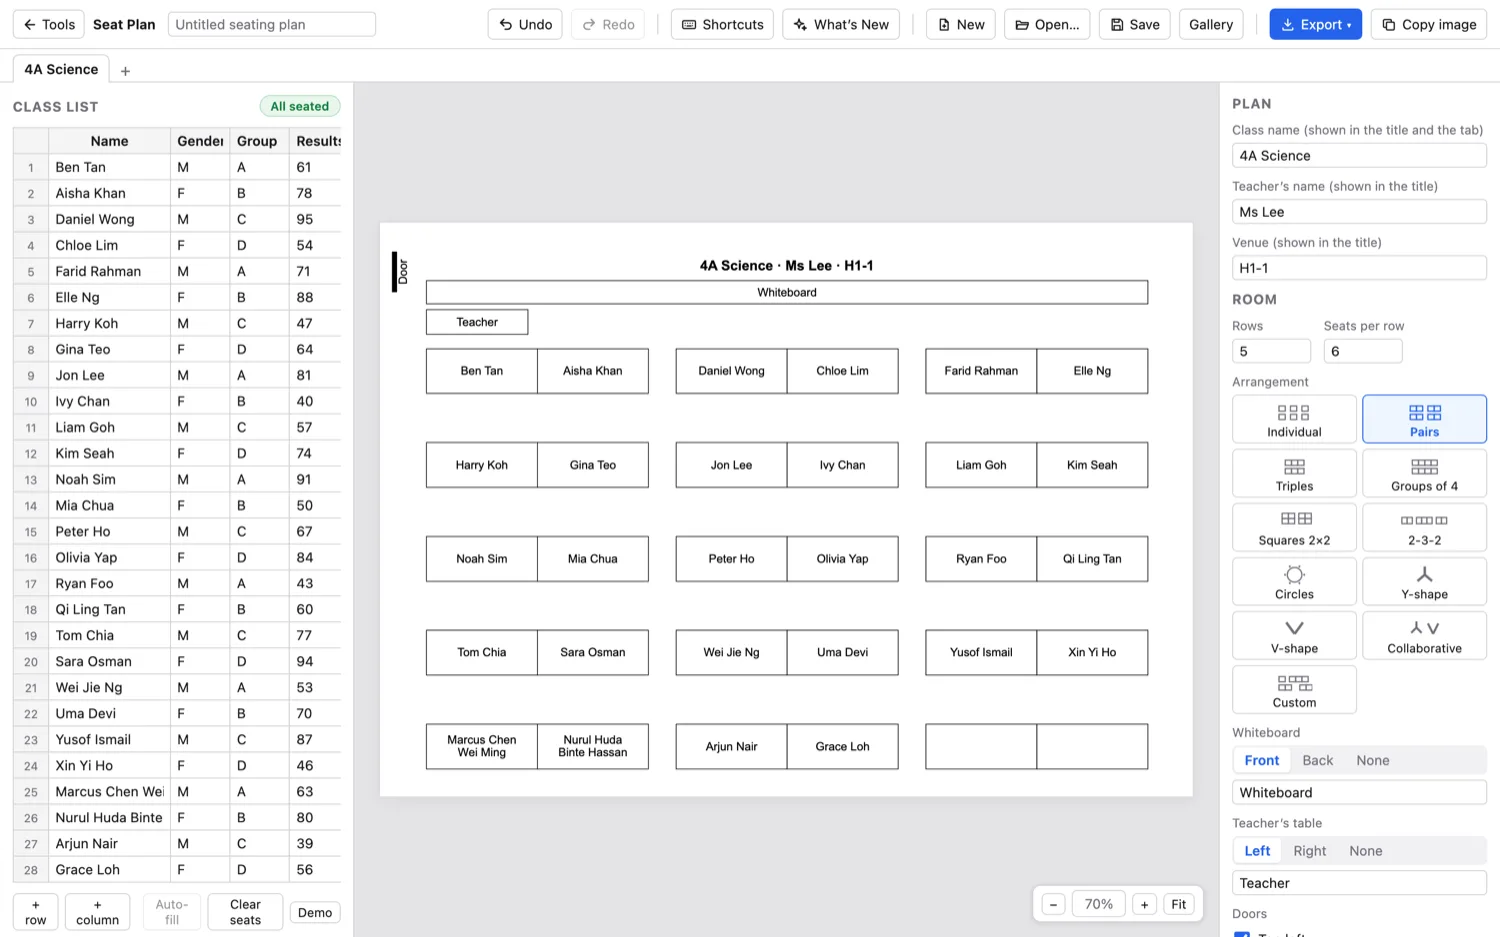
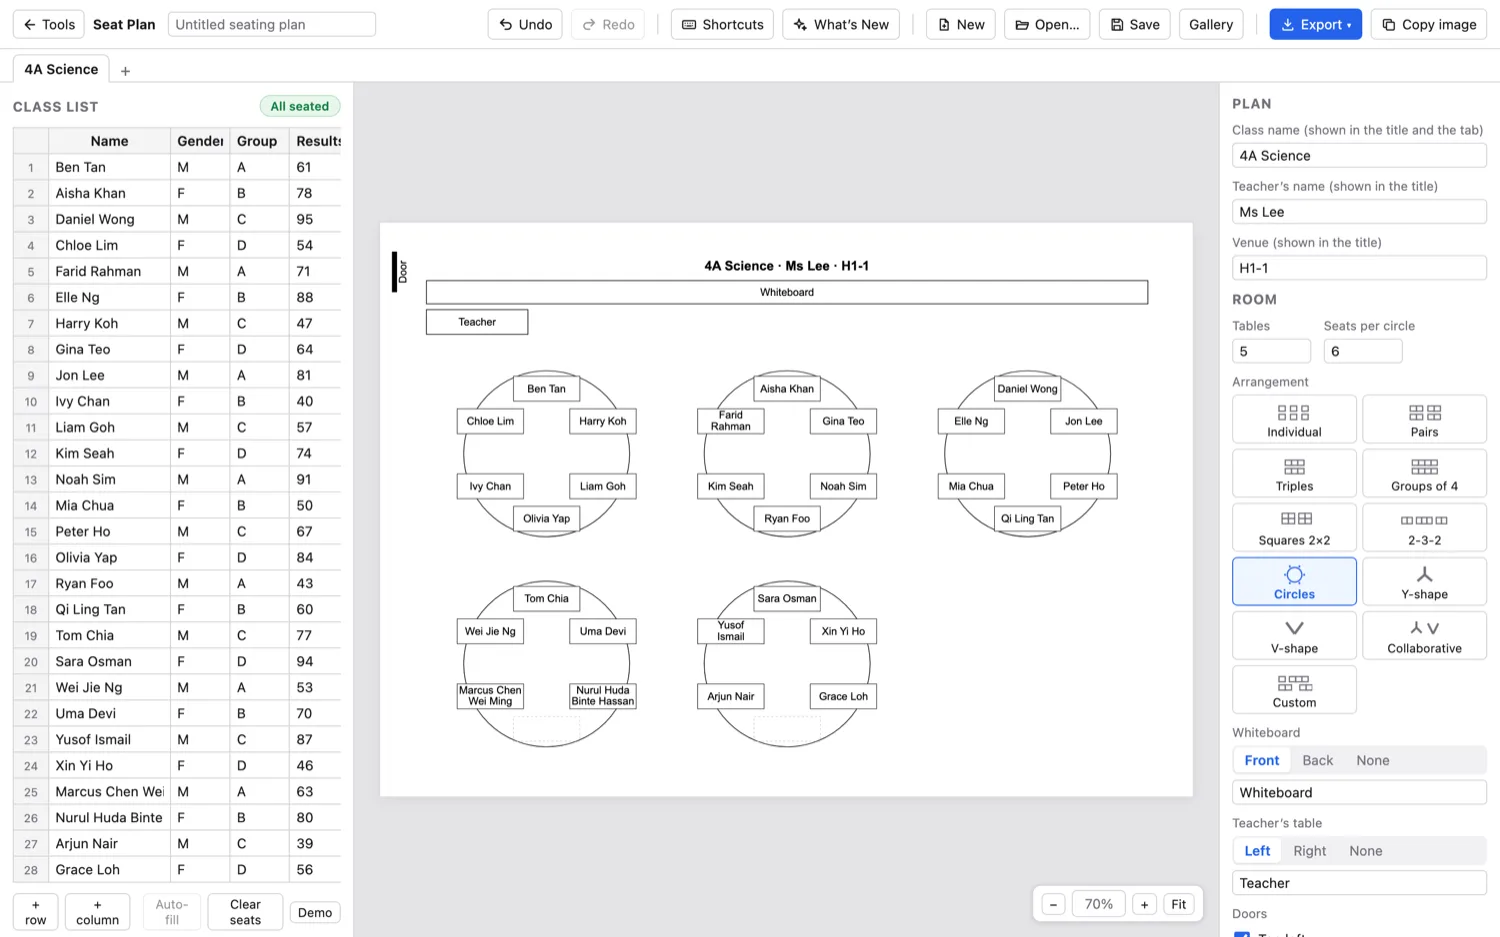
Seat Plan
A seating chart in a minute.
Paste your class list, pick a layout, then drop names into seats or let it fill them. Colour students however you like and print to scale.
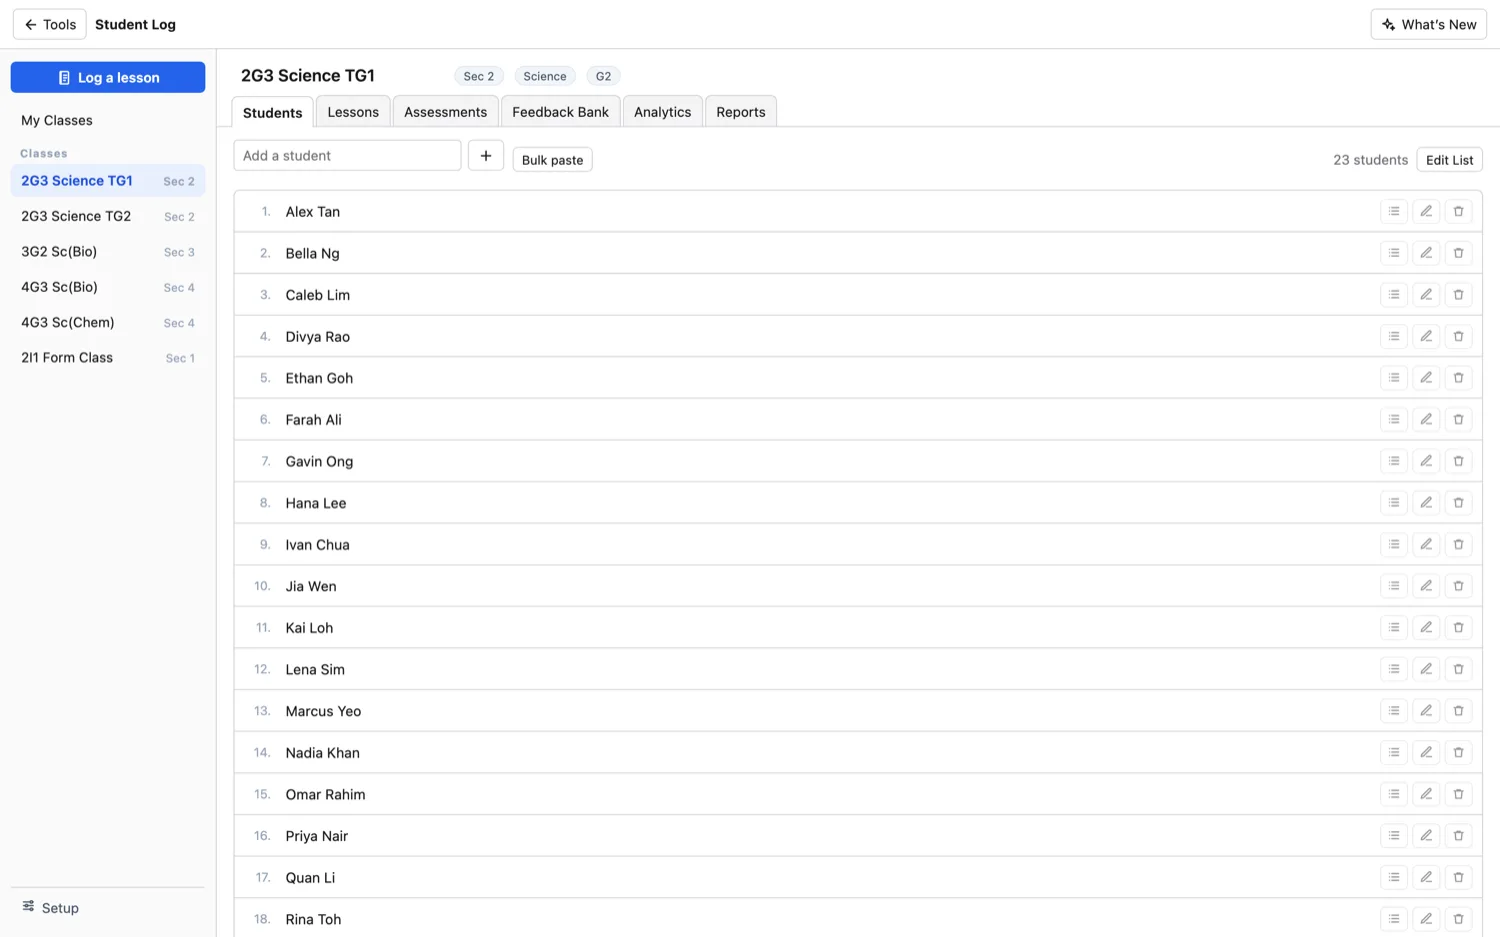
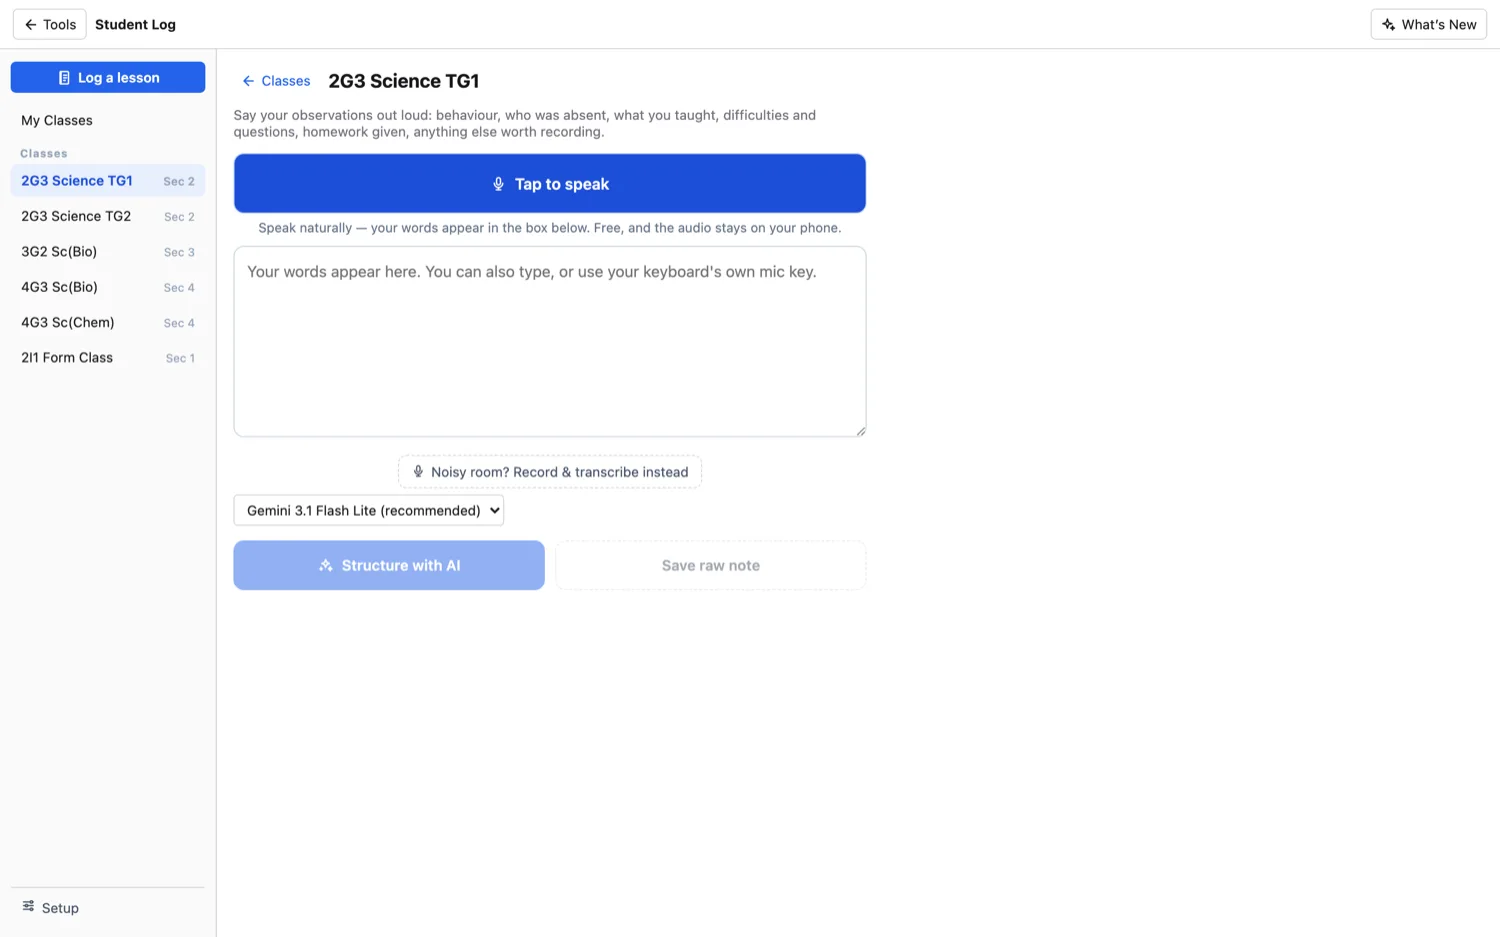
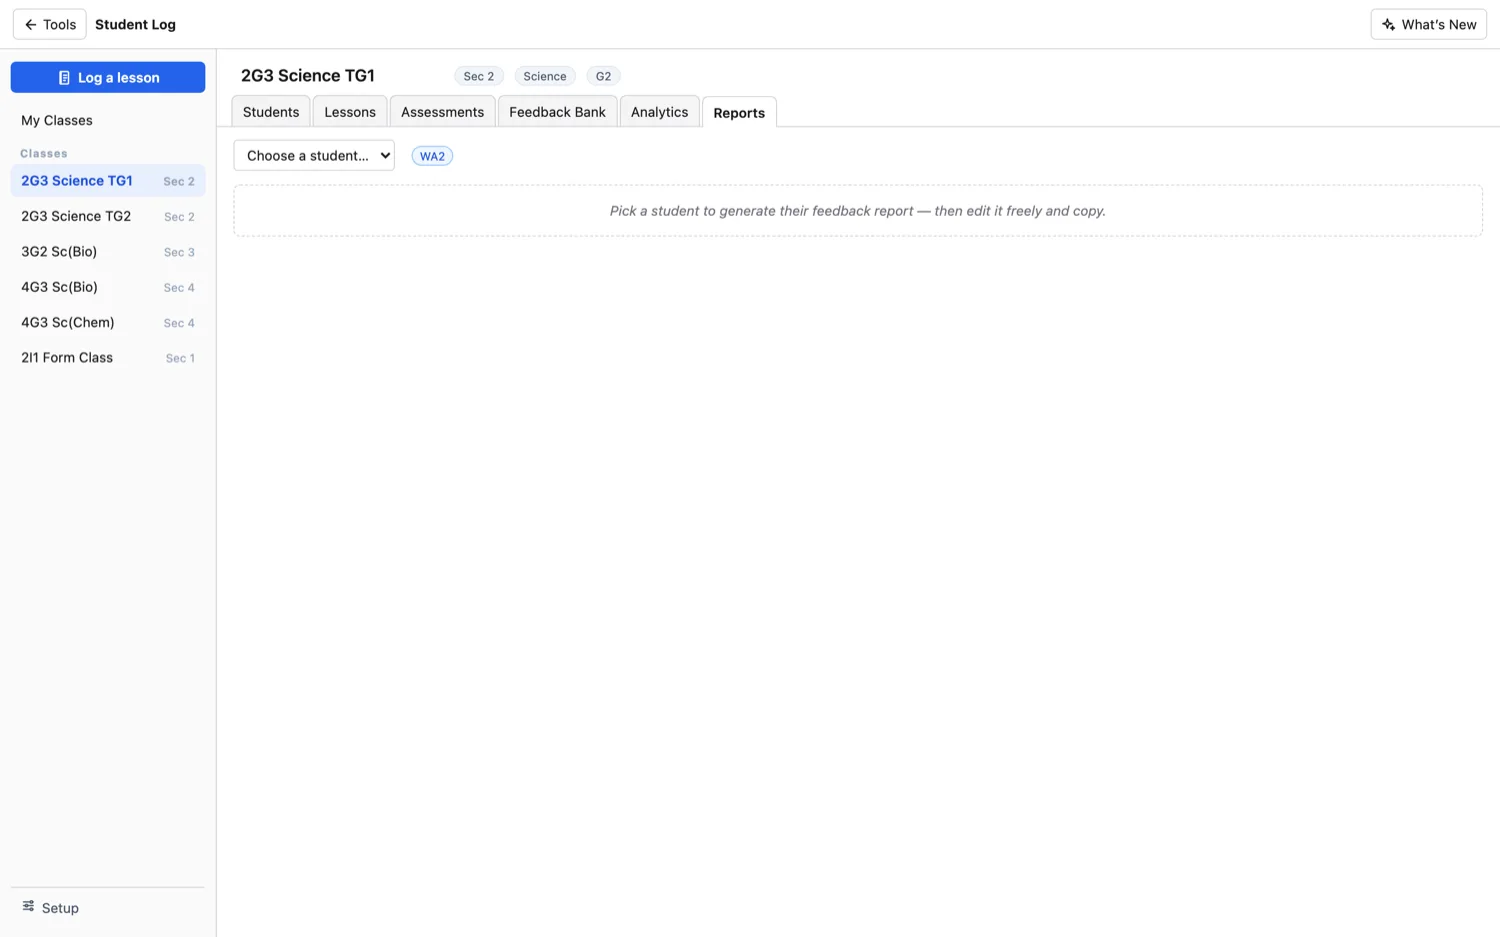
Student Log
A running record for every class.
Track students, lessons, assessments and feedback for each class. Say your observations out loud after a lesson and the AI writes them up per student.
The names shown are made up.
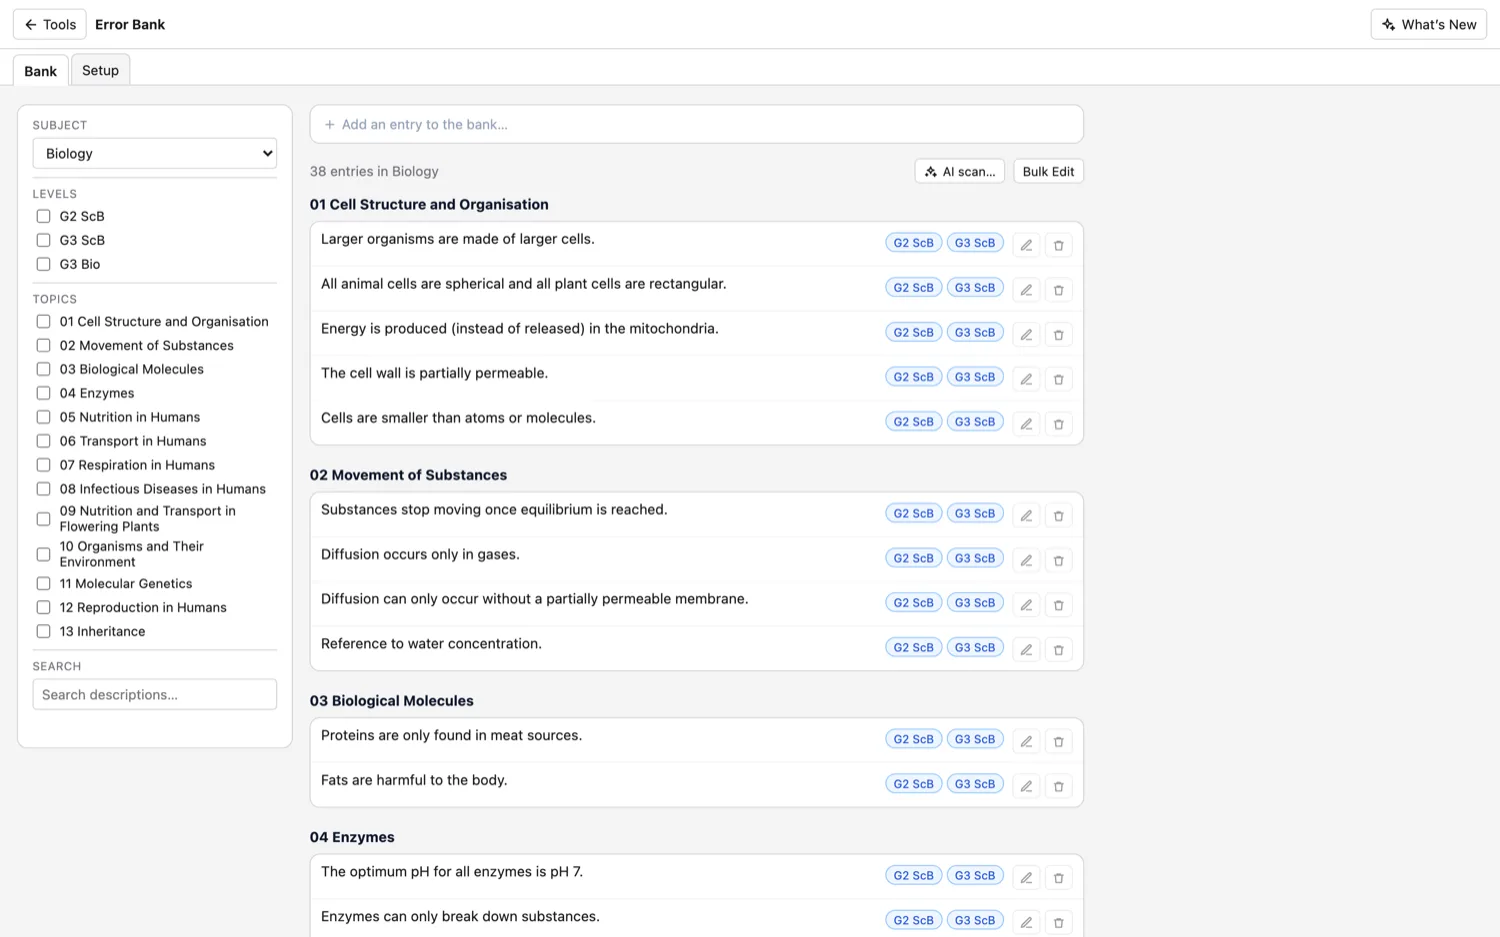
Error Bank
The mistakes students keep making.
Save the common errors and misconceptions for each topic. Add them yourself or scan a marked script, then bring them up when you teach and give feedback.